Market Internals Setup, NYSE Tick and Market Breadth: Thinkorswim
0
Read More
The 4 core market internals consist of: Breadth Ratio Advance Decline Line Trin Tick You can use them to better pinpoint your entry and exits and get a good gauge of the market. In the video below I show how to setup market internals on the thinkorswim platform.
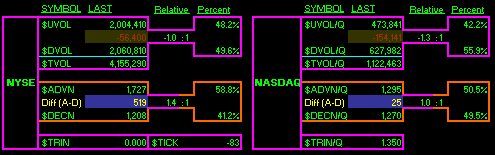
This market internal indicator, the market breadth (aka the breadth ratio) is a figure composed of the ratio of volume flowing into up stocks compared to the amount of volume flowing into down stocks. A breadth ratio relative to 1 is generated. Example: A day with 10M shares of advancing volume and 5M shares of declining volume results in a breadth of 2:1 Positive, 2x as many shares are rising than falling. How to Use Market Breadth We look to…