Swing Trading, Day Trading & Technical Analysis (now at EminiMind.com)

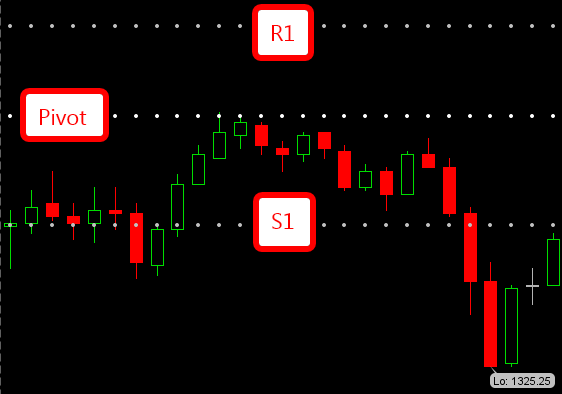
Day Trading with Pivot Points

The pivot point for the day is calculated by taking the prior day’s (High + Low + Close) / 3. These are commonly used by floor traders in the trading pits to identify key support and resistance levels. If the market opens above the daily pivot, look for short entries for a move down to test the pivot and vice versa. If the pivot isn’t tested in the morning session, then look for it to test in the afternoon. Daily…

0
Read More

Secrets of Successful Traders

The Secrets of the Successful Trader… The trading game is as much played psychologically as it is physically executing trades. After the markets are closed is where average traders turn into successful traders. To be a successful trader it takes a specific skill set, but more importantly the proper mindset. The techniques, strategies, and lingo can be readily learned, it’s the other side, the psychological aspect which turns an average trader into a successful trader. Create a Business Plan –…

0
Read More

New Target for the SP500, Higher or Lower?

The ES, or the E-mini S&P Futures hit a pivotal level on 4/18 which has sent the market screaming higher. As we continue to drive higher and break prior highs, more and more stops will be hit which in turn sends the market high. We need sellers at highs to make new highs and buyers and lows to make new lows. This is because the stops that the sellers place at highs (just about the highs) will be fuel for…

0
Read More

Is the Market Headed for a Breakout?

The inverted head and shoulders that we talked about last week is fulfilling its end of the bargain, did you get long? Here is a look at the top line figures over the past few years. Notice that the NASDAQ and Russell are leading the way higher. This makes sense as a technology and small caps are where the most entrepreneurship and growth comes from as we work our way out of a recession. The VIX is about to rip,…

0
Read More

What is Technical Analysis?

Have you ever wondered why technical analysis works? Technical analysis is the study of chart patterns and technical indicators used to develop entry and exit points for placing trades. Here is a great online free resource, a course in technical analysis. The basis for most technical analysis is candlestick charting 101, and Steve Nison’s book Japanese Candlestick Charting Techniques, is the go to book for learning these methods. Aside from the self fulfilling prophecy, often times price moves in the…

0
Read More

Watch Out for the Larger Time Frames

When we trade intraday or even daily setups we often forget about the larger time frames. When I do my analysis for the week I always begin on the monthly chart and work my way down to the smaller time frames. Potential Inverted Head and Shoulders Forming What out for a potential inverted head and shoulders in the markets over the next two weeks. These are usually defined with a hammer which can make for difficult intraday trading.

0
Read More
Categories