The hammer candlestick is a very common and reliable pattern for the reason that it has a defined failure levels. Those levels would be below the tail and about the high and these can signal a strong move to new highs or lows.
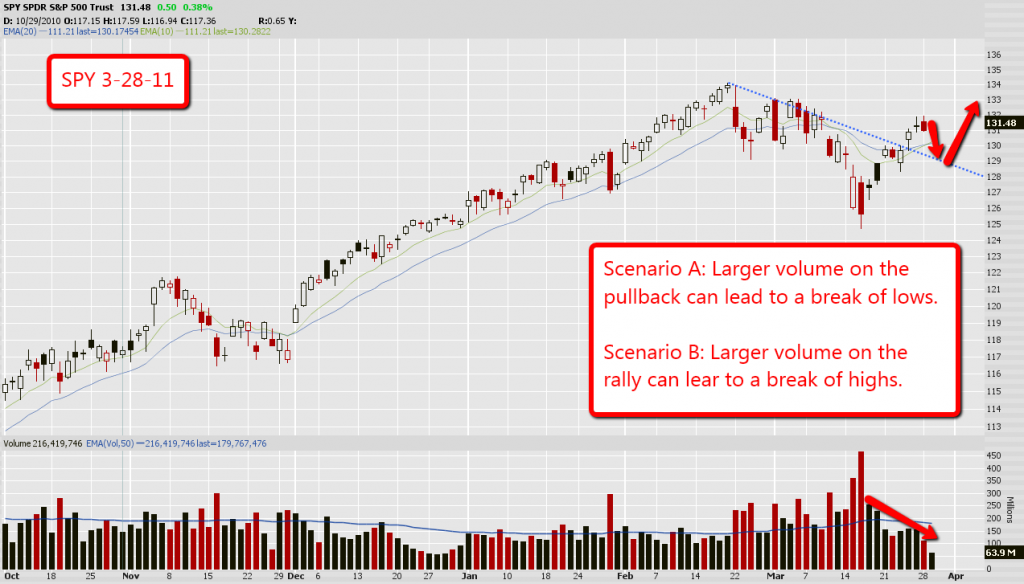
In the recent rally we have seen in the S&P500 we broke above the down trendline. What usually happens from here is a retest of this trendline, old resistance now acts as new support. We are anticipating a pullback to this trendline before a continued rally.
One thing to keep your eye out for is a hammer candlestick on the daily chart. Intraday this can look like a giant V and really cause some voilent moves intraday. Knowing where we are on the daily chart we are able to prepare and keep in the back of our minds that the hammer candlestick could be coming this week on the daily.
You can find more information on the hammer candlestick and other charting patterns in our price pattern articles and in the book Japanese Candlestick Charting Techniques by Steve Nison.
