Simple Tips for Struggling Swing Traders
0
Read More
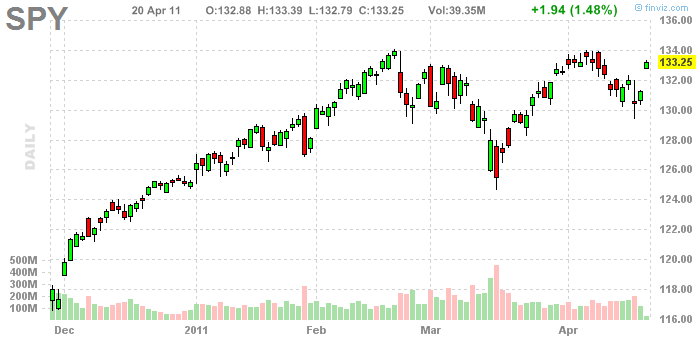
The image above should tell the whole story. We’ve been going sideways for the past two months. Surprisingly it has made for some decent trading, but just wait until we begin trending again. Things will really start to pickup in the options markets because the moves in the individual underlying will trend more. In these conditions of sideways and high volatility it’s important to stick to your rules and WAIT for your setups and remain patient. As always, think risk…
We’ve seen it before. If you zoom out to a daily you’ll notice it looks very choppy, this is one of the most difficult conditions to trade, just look at May 2010. Stay patient, watch for confirming breakout in the VIX if we do make new lows. A rally to 1225 on the ES before selling off again is possible. SPY August 2011 compared to… SPY May 2010
Heikin Ashi charts are similar to candlestick charts except the color coding of the bars changes in relation to the prior bar. This makes it much easier to identify the trend changes and pick out technical patterns in the market.
We’re looking for a rally to 1390, however before we do so we may pullback into the next daily halfway back setup.
Have you ever wondered why technical analysis works? Technical analysis is the study of chart patterns and technical indicators used to develop entry and exit points for placing trades. Here is a great online free resource, a course in technical analysis. The basis for most technical analysis is candlestick charting 101, and Steve Nison’s book Japanese Candlestick Charting Techniques, is the go to book for learning these methods. Aside from the self fulfilling prophecy, often times price moves in the…
When we trade intraday or even daily setups we often forget about the larger time frames. When I do my analysis for the week I always begin on the monthly chart and work my way down to the smaller time frames. Potential Inverted Head and Shoulders Forming What out for a potential inverted head and shoulders in the markets over the next two weeks. These are usually defined with a hammer which can make for difficult intraday trading.