Candlestick 101

DeJa Vu of May 2010

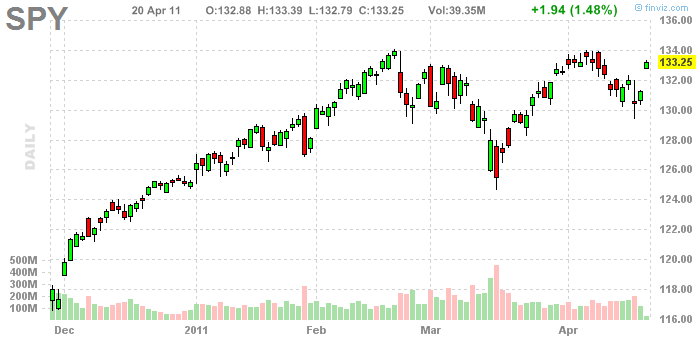
We’ve seen it before. If you zoom out to a daily you’ll notice it looks very choppy, this is one of the most difficult conditions to trade, just look at May 2010. Stay patient, watch for confirming breakout in the VIX if we do make new lows. A rally to 1225 on the ES before selling off again is possible. SPY August 2011 compared to… SPY May 2010

0
Read More

What is Technical Analysis?

Have you ever wondered why technical analysis works? Technical analysis is the study of chart patterns and technical indicators used to develop entry and exit points for placing trades. Here is a great online free resource, a course in technical analysis. The basis for most technical analysis is candlestick charting 101, and Steve Nison’s book Japanese Candlestick Charting Techniques, is the go to book for learning these methods. Aside from the self fulfilling prophecy, often times price moves in the…

0
Read More

The Hammer Candlestick

The hammer candlestick is a very common and reliable pattern for the reason that it has a defined failure levels. Those levels would be below the tail and about the high and these can signal a strong move to new highs or lows. In the recent rally we have seen in the S&P500 we broke above the down trendline. What usually happens from here is a retest of this trendline, old resistance now acts as new support. We are anticipating…

0
Read More

The Doji Candlestick

The doji is a candlestick formation that can be seen on any time frame, but the larger the time frame which forms the doji, the greater the significance. This candlestick pattern represents an even balance between buyers and sellers at the close of the doji candle. The Doji Itself There are really two important factors to look at with the doji candlestick formation, the first being the doji itself. Whether or not the candle closes just slightly positive, slightly negative,…

0
Read More

Candlestick 101

One of the most important parts of technical analysis is candlestick 101. The candlestick charting method was brought to the United States by a man names Steve Nison. Nison is known as the founding father to candlestick 101 in the western part of the world. His book, Japanese Candlestick Charting Techniques includes everything from the basics, such as constructing the candlesticks and learning the patterns, to advanced topics, such as the rules of multiple technical techniques. These candlestick charting methods…

0
Read More

Candlestick Charting 101

Candlestick charts are a simple and effective way to read the days price action. Originating in Japan, Steve Nison brought the candlestick charting method to the west and is widely used in technical analysis to this day as candlestick charting can be used and applied across any trading vehicle or time frame. The candlestick is made up of two parts, the body and the shadow. A body that is filled in means prices opened higher than they closed. A body that is not shaded means…

0
Read More
Categories