Market Internals Setup, NYSE Tick and Market Breadth: Thinkorswim
0
Read More
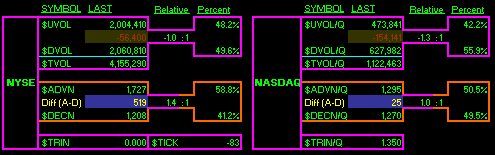
The 4 core market internals consist of: Breadth Ratio Advance Decline Line Trin Tick You can use them to better pinpoint your entry and exits and get a good gauge of the market. In the video below I show how to setup market internals on the thinkorswim platform.
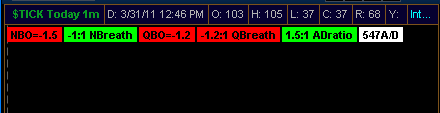
This market internal indicator, the market breadth (aka the breadth ratio) is a figure composed of the ratio of volume flowing into up stocks compared to the amount of volume flowing into down stocks. A breadth ratio relative to 1 is generated. Example: A day with 10M shares of advancing volume and 5M shares of declining volume results in a breadth of 2:1 Positive, 2x as many shares are rising than falling. How to Use Market Breadth We look to…
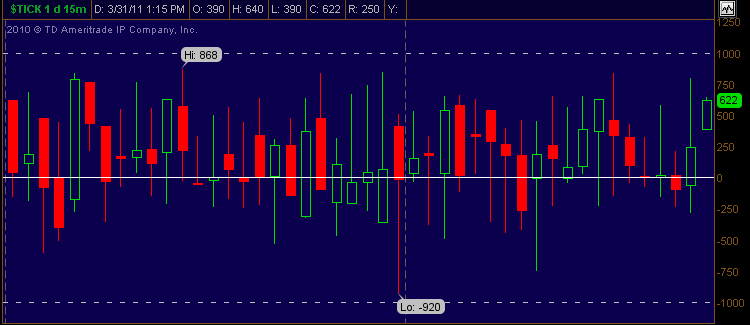
The NYSE Tick Index is a short-term trading index which takes the difference in up ticking stocks from down ticking stocks. Here’s a video of live trading with the NYSE Tick. For example: if there are 2000 stocks trading on the NYSE and 1500 trade higher from the previous price and 500 trade lower from the previous price the Tick Index will read +500 (1500 – 500). Using the NYSE Tick The Tick Index is a used to and validate…
Developed by Richard Arms in 1989, the Arms Index, also called the TRIN (TRaders’ INdex) is designed to detect overbought and oversold levels in the markets. The indicator looks at the number of advancing stocks versus declining stocks combined with how much volume is flowing into these stocks. Using the Trin This is a contrarian indicator, meaning it has an inverse relationship with the market. A ratio of 1 means the market is at parity, above 1 indicates more volume…
The advance decline line (aka AD line) is a number composed of the net sum of advancing stocks minus the number of declining stocks. This number is calculated separately for the NYSE and the NASDAQ. This is one of four market internals indicators, the other 3 are Market Breadth, the NYSE tick, and the Trin. Example: A day with 500 advancing stock and 2000 declining stocks would yield an a/d line of -1500. How to Use the Advance Decline Line…